Introduction
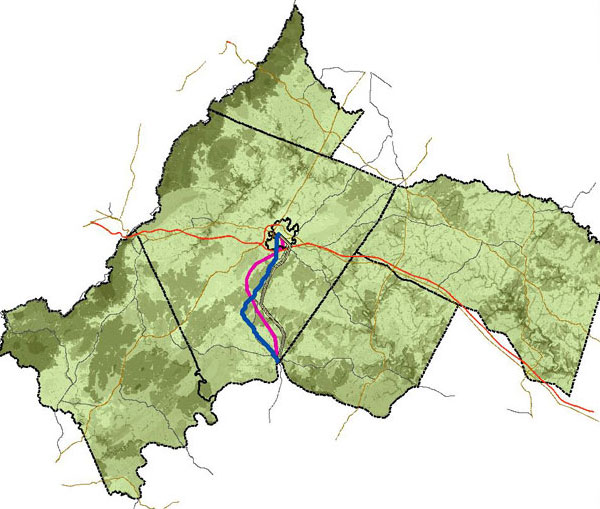
The tool was developed with financial assistance from the Federal Highways Administration and is based on a framework developed by FHWA that was adapted to local constraints and considerations. The tool consist of a rasterized heat map that through analyses identifies areas with the greatest conservation need. This functionality allows those involved in project development to quickly identify areas that should be avoided like wetlands, floodplains and endangered species habitats.
Utilizing standard GIS software the REF dataset serves as a base for conducting several different kinds of spatial analyses. The analyses methods include the ability to identify areas of high resource concentration in the PDC. The ability to score and compare potential environmental impacts associated with various kinds of land disturbing projects. This analyses can be easily performed and can be used during project planning to help identify ecologically sensitive project alternatives.
The Tool and Datasets

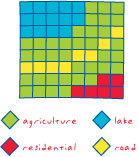
TJPDC’s Regional Ecological Framework tool or REF was developed by TJPDC staff with the assistance of a panel of experts. The tool consists of a GIS Raster Dataset that provides a PDC wide score for habitat value and the concentration of environmental resources. The raster dataset is made up of 30 by 30 meter cells. These cells each have a numeric value that range from 2 to 52. These values provide the means for identifying and mapping what areas in the Planning District have higher or lower ecological value.
The tool was created by combining 10 separate habitat related GIS datasets into a single raster layer. To do this each dataset and subsequent attributes were given a rank between 2 and 10 by a panel of experts. More information about the methodology for combining the datasets is available in the Eco-Logical: Integrating Green Infrastructure and Regional Transportation Planning Report.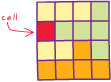
Click the Dataset’s name for full details.
| Dataset | Attribute | Rank |
| DGIF Tiered Species Habitat (terrestrial and aquatic) | 2 | 10 |
| 1 | 8 | |
| DGIF Threatened & Endangered Species Waters | Tier I | 10 |
| Tier II | 8 | |
| DGIF Species Observations – Diversity, # of Species Present | 1 | 4 |
| 2 | 6 | |
| 3 | 8 | |
| 4 | 10 | |
| DCR Virginia Natural Landscape Assessment (VaNLA) | ||
| Habitat Cores | 1 | 10 |
| 2 | 8 | |
| Habitat Corridors | 2 | |
| Cores 3 – 5 that intersect corridors | 3 | 6 |
| 4 | 4 | |
| 5 | 2 | |
| DCR Priority Conservation Sites | B1 | N/A |
| B2 | 9 | |
| B3 | 8 | |
| B4 | 7 | |
| B5 | 6 | |
| General Location | 4 | |
| Audubon Important Bird Areas | 4 | |
| USFWS National Wetlands Inventory | wetlands | 8 |
| 200′ buffer | 6 | |
| DCR VCLNA Watershed Integrity Model | 5 | N/A |
| 4 | 8 | |
| 3 | 6 | |
| 2 | 4 | |
| 1 | 2 | |
| NHD 1:100,000 streams | ||
| 1st order | 50′ buffer | 3 |
| 2nd order | 75′ buffer | 3 |
| 3rd order and above | 100′ buffer | 3 |
| DGIF Cold Water Stream Survey – Classes I – IV – 100′ buffer | Class I | 7 |
| Class II | 6 | |
| Class III | 5 | |
| Class IV | 4 | |